(C01-4)
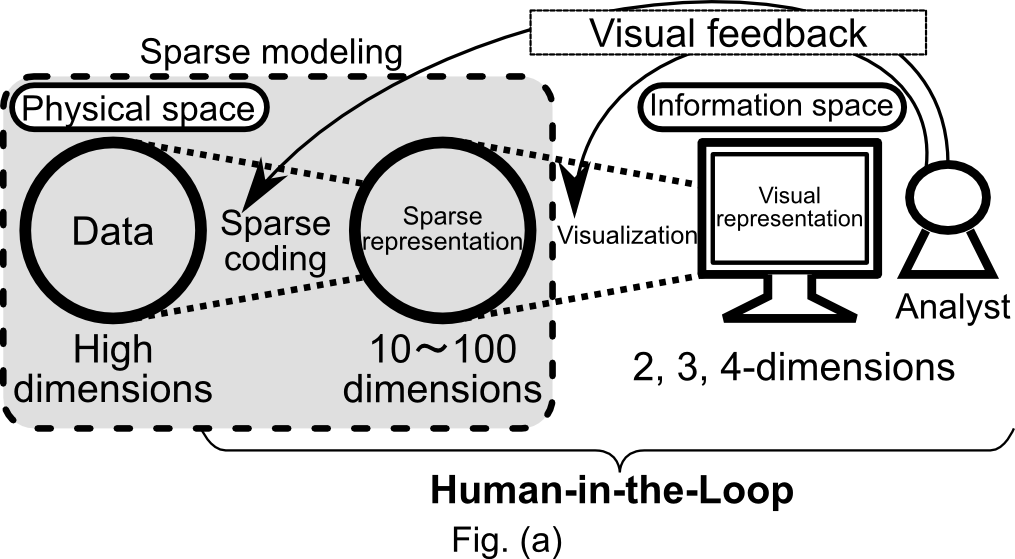
The goal of this is to build a visualization platform for understanding the behavior of given high-dimensional data in physical space by projecting it onto a designated information space. For this purpose, we transform relatively low-dimensional data obtained through sparse modeling to 2, 3, or 4-dimensional space where we can fully visualize the characteristics of the original high-dimensional data. The idea behind our project is to establish an interactive model called human-in-the-loop by incorporating visual feedback from the users in the analysis of high-dimensional data based on sparse modeling (Fig. (a)).
In the machine learning field, under the sparseness assumption of high-dimensional data, sparse modeling provides effective methods to explain important latent features underlying the data. The results of them, however, are represented by dozens of dimensions. Further dimensionality reduction to 2-, 3-, or 4-dimensional representation has usually been optimized in terms of preserving information content and rarely been optimized through interaction with humans in terms of human visual interpretation. In the data visualization field, visualization methods of high-dimensional data have been intensively studied as tools for finding the correlation between variables contained in the data. Existing data visualization techniques, however, are simply combining variables or naïve dimensionality reduction methods and are not sufficient to extract essential features of the data.
The project members have worked on high-dimensional data analysis and presented their research results in the fields of both machine learning and visualization. They noticed that machine learning and visualization are complementary. That is, machine learning provides methods to effectively reduce dimensionality of high-dimensional data through sparse modeling while visualization provides methods to enhance the interpretation of data through transformation to low-dimensional visual information. This led to the basic idea of combining machine learning and visualization to drastically improve high-dimensional data analysis techniques.
To realize a human-in-the-loop mechanism that respects the role of the human analysts in the repeated process of high-dimensional data analysis, we attempt to address the following three challenges.
- [Subject 1] Machine Learning for Selection Process of Optimal Quotient Mapping
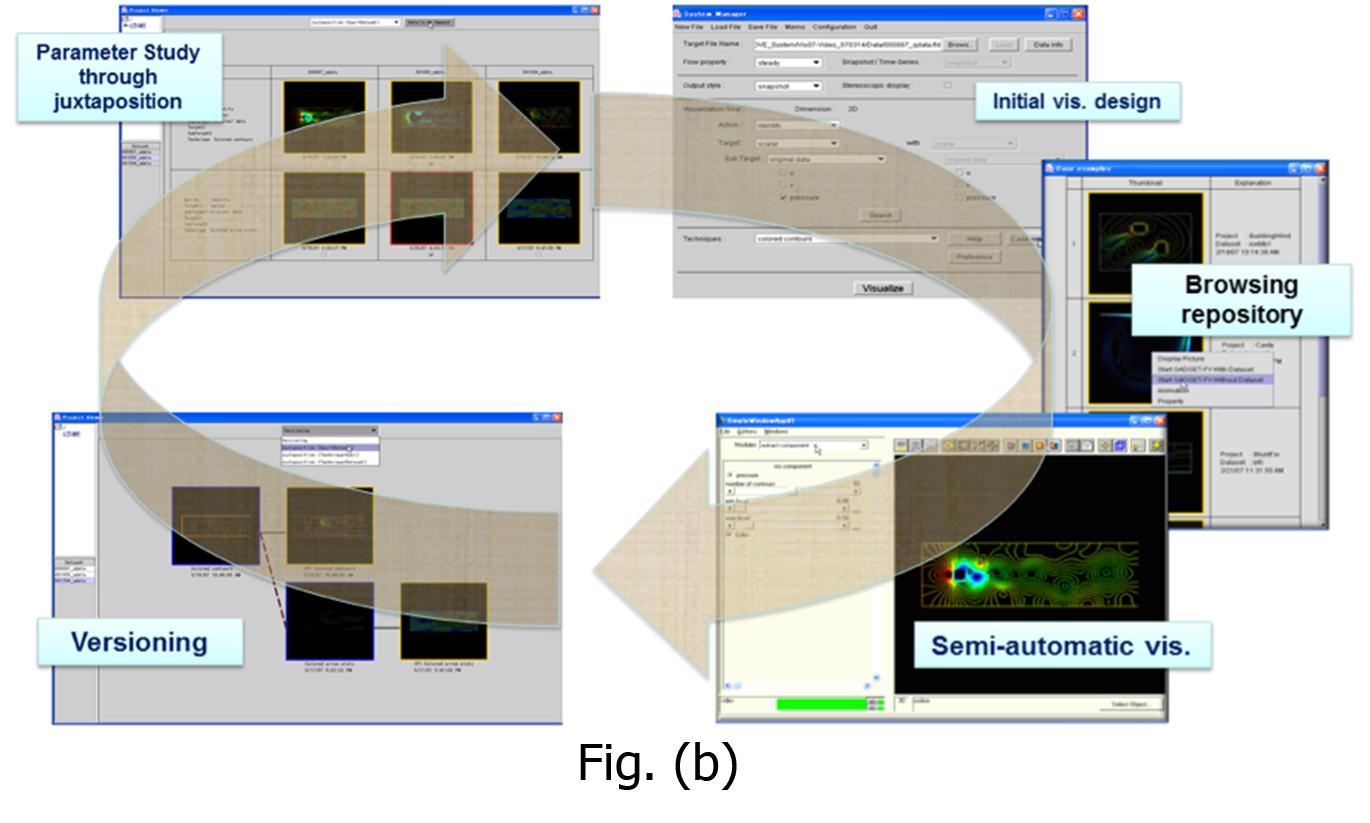
This subject aims to learn the history of interactions between visualization systems and human analysts to provide appropriate quotient mappings to map high-dimensional data to a low-dimensional space. By assuming probabilistic models for features extracted from the history, we apply Bayesian inference based on visual saliency and investigate the characteristics of inferred quotient mappings (Fig. (b)). - [Subject 2] Latent Variable Model for Selecting Quotient Space Representations
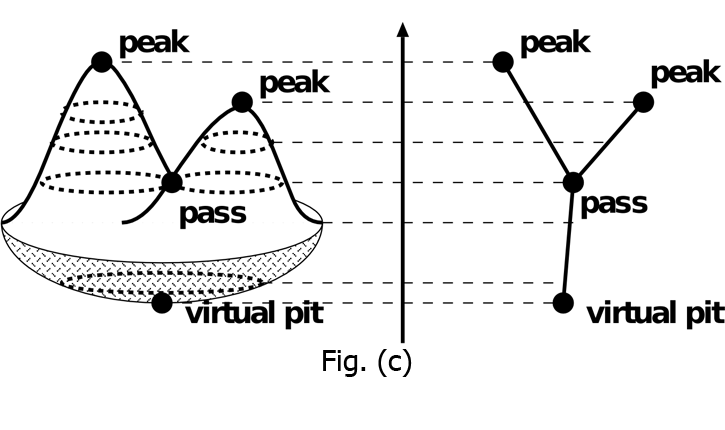 This subject aims to construct an approach for transforming relatively low-dimensional data obtained through the sparse modeling to screen space for visualization purposes. More specifically, we compose a proximity graph from the low-dimensional samples obtained from the sparse modeling and then extract characteristics inherent in the given data by calculating the low-dimensional manifold structures as a quotient space under an appropriate equivalence relation (Fig. (c)).
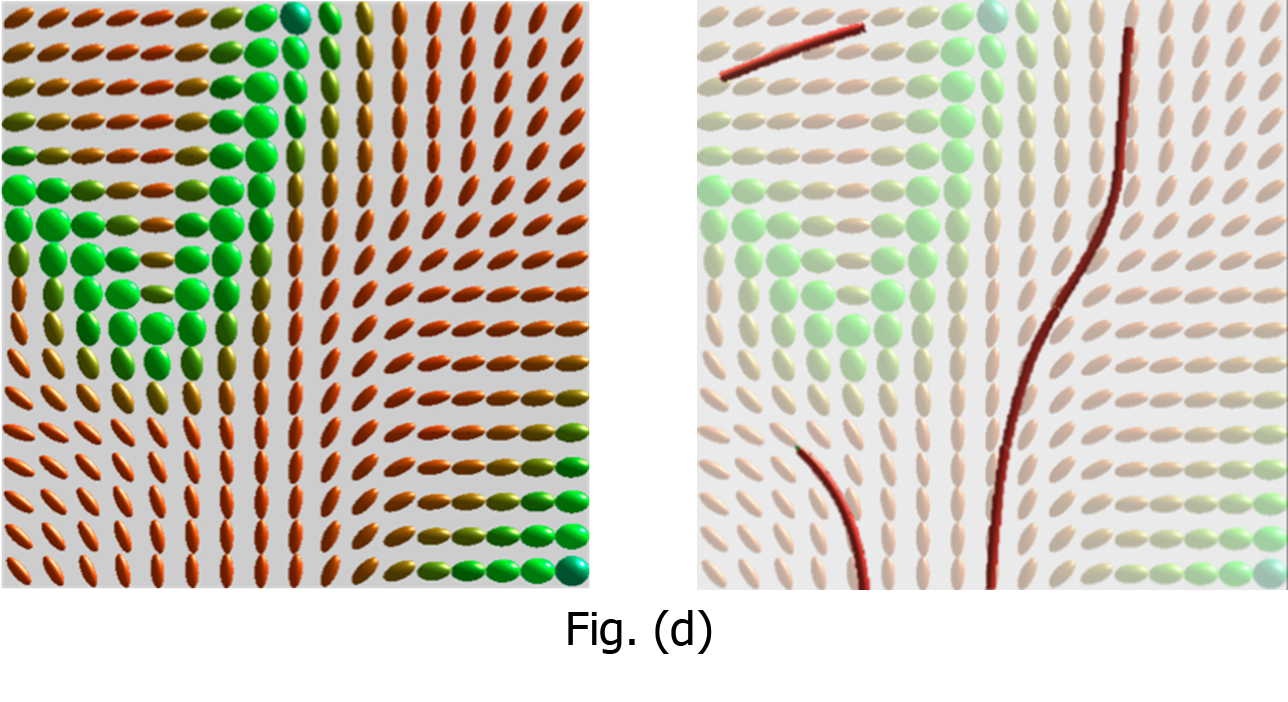
- [Subject 3] Visual Metaphor and Glyph Design for Dimensionality Reduction Mapping
We formalize the principles that transform the low-dimensional data obtained through Subject 2 to comprehensible visual forms. Specifically, we re-examine various visual patterns utilized in the traditional high-dimensional data visualizations and quotient mapping representations and put them into a proper perspective, which allows us to customize the fundamental designs of visual metaphors (something in the reality for making abstract computing principles tangible) and glyphs (i.e., icons or pictograms) for visualization in sparse modeling (see Fig. (d)).